Product Design

Digital Transformation

End-to-End

Persona

Wireframes

Collaboration

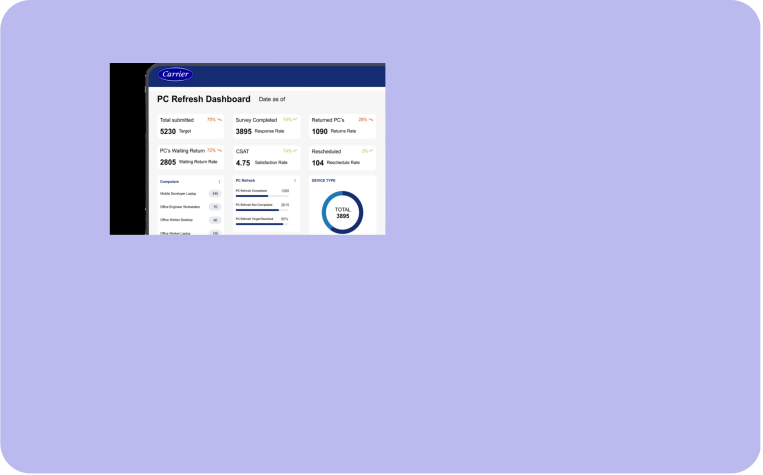
Carrier's PC Upgrade Program Dashboard

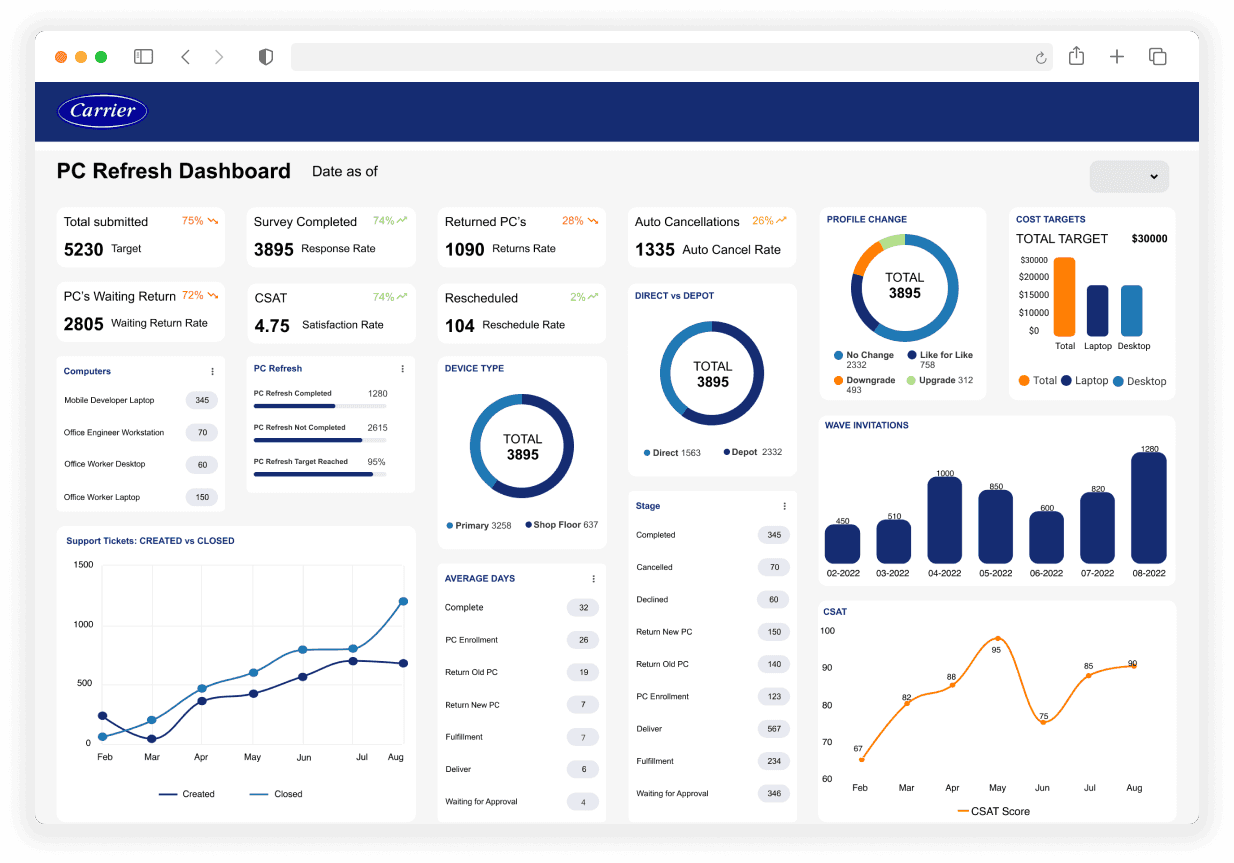
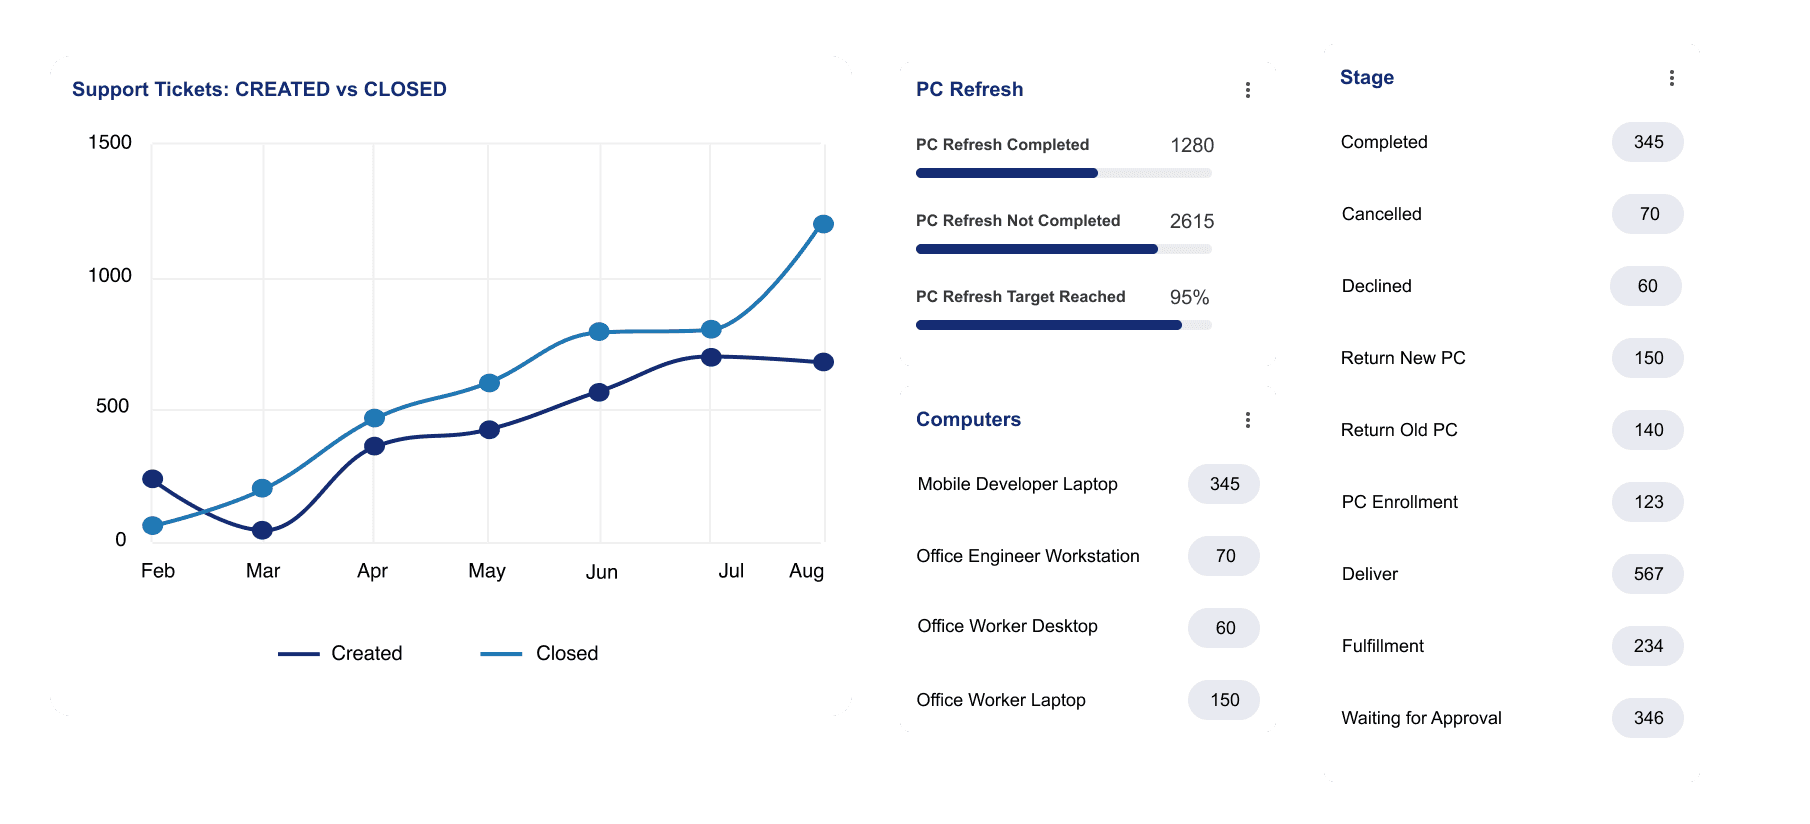
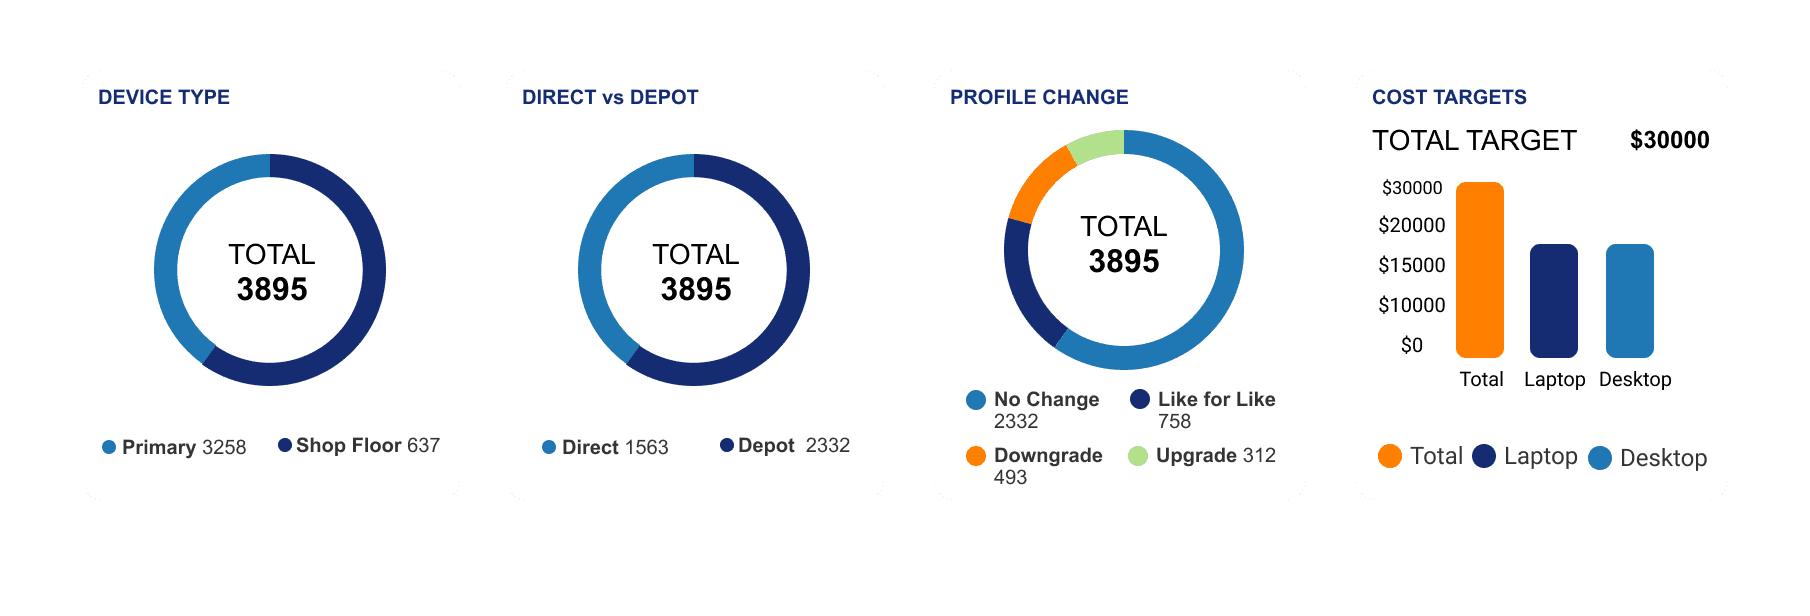
Introduced a dashboard that allows executives to monitor over 53K employees’ PC upgrade process.

20%

Increase in Cost Saving

TIME LINE

3 Months

COLLABORATION

DTC Team

MY ROLE

Product Designer

SEGMENTS

Executive Dashboard

Background

​Carrier Global Corporation is a leading American multinational specializing in heating, ventilation, and air conditioning (HVAC), refrigeration, and building automation systems. With approximately 48,000 employees and annual revenues exceeding $20 billion, Carrier continues to innovate in sustainable and intelligent climate and

PROBLEM DEFINITION

Defining the challenge

What is the problem?

Executives often have zero visibility of the PC upgrade program, which leads to increased unsuccessful employee PC onboardings and high program costs. Without visibility, they cannot take proper action on actionable tasks to reduce unsuccessful onboarding.

What did Carrier want to achieve?

Carrier aims to introduce a minimum viable product (MVP) dashboard that enables executives to monitor the program and identify potential issues it may encounter.

HOW MIGHT WE

How might we provide executives with timely, accurate, and real-time visibility into communication and reporting on the PC upgrade program?

DISCOVERY & RESEARCH

Understanding user pain points

As the project continued, I hit a roadblock regarding how to gain access to the executives who monitor this program. But with the help of the PM, I gained acess to interview some of them. I interviewed them and asked about their pain points regarding their communication on the program.

I conducted user interviews to validate and expand upon insights from the stakeholder interviews. I uncovered day-to-day bottlenecks, revealing how existing communication gaps and manual processes slow down the overall PC upgrade tracking.

What employees are feeling

"While looking at the program, I have to talk or email multiple managers to get the full picture of this program."

— Executive 1

“We waste hours each week sorting through email threads and spreadsheets just to figure out which departments have finished the upgrade.”

— Carrier Manager

Where does the roadblock Occur with Executives ?

Time-consuming

Executives mentioned that it took them a couple of correspondent email to figure out what was happening in the program as a whole.

Lack of visibility

Excuective felt they only had some visibility for ROI success in the PC upgrade process.

Multiple email threads

IT Teams rely heavily on multiple email threads, causing delayed updates.

Delayed updates

Delayed updates often mean executives receive outdated information.

PROCESS & RATIONALE

From insight to structure

Painting the user's perspective from both sides

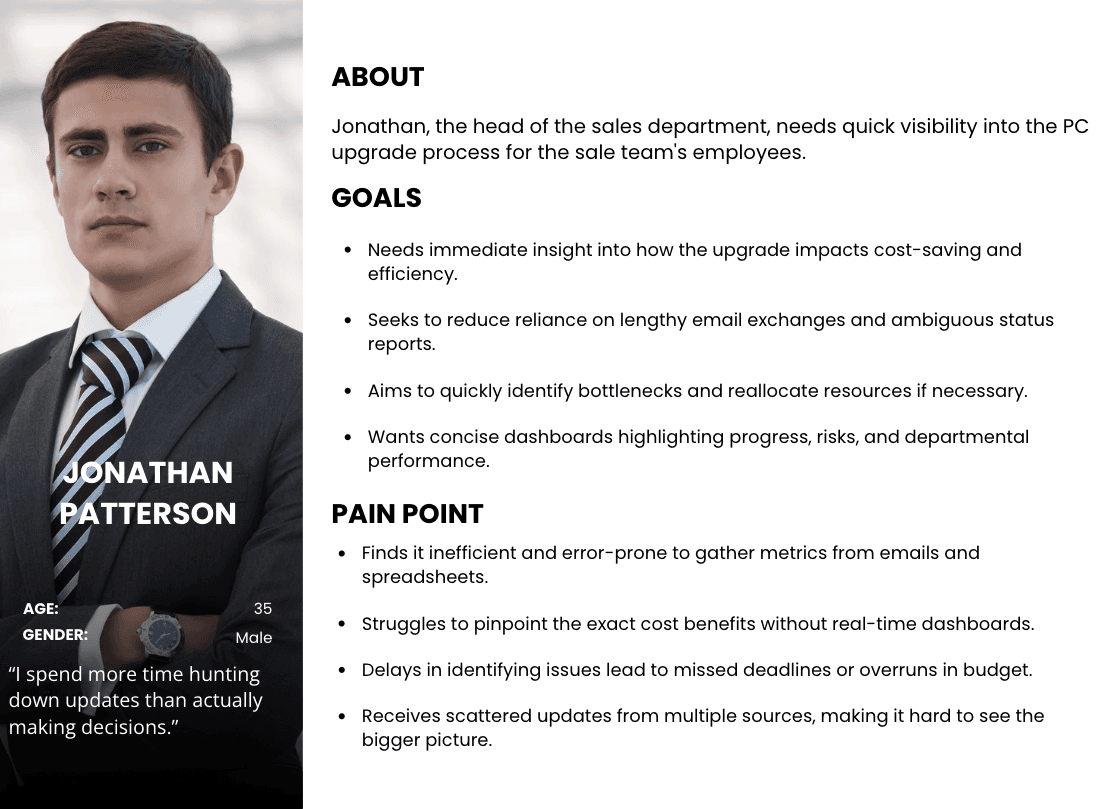
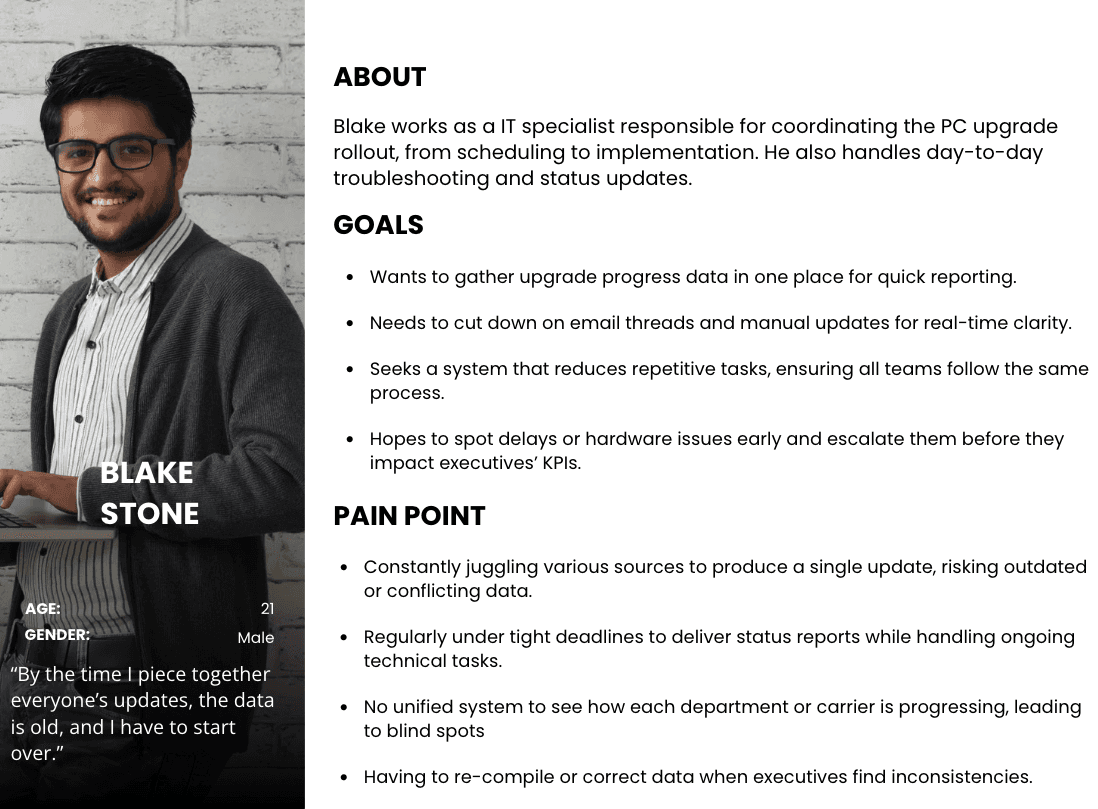
Before taking any action, I wanted to understand the broader context from everyone involved. So I developed these two personas to illustrate how each group experiences the PC upgrade process differently, revealing the root causes behind outdated data and communication gaps.

Persona 1 - Jonathan

Persona 2- Blake

SOLUTION

Designing the new experience

After define who are the main target audience, I began working on the wireframes. I presented it to some executives and IT members and mangers in a walkthrough as Iteration 1, which showed all the main metrics they wanted to see. However, they felt it was a cognitive overload, and they couldn't focus on the key aspects they wanted to know about the process as a whole.

Low fidelity - Iteration 1

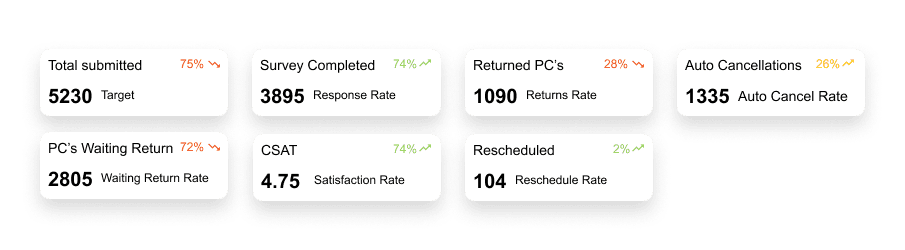
In round two of the testing sessions, I presented the both target audience, with version 2 of the dashboard, prioritizing the data they found most important to know in the PC upgrade process. I also ensured that less critical information didn’t overshadow it.

As a result, the executives unanimously chose to move forward with Iteration 2.

Low fidelity - Iteration 2

Final design — PC Upgrade Program Dashboard

After the stakeholder feedback, I started working on the high-fidelity prototype, which highlighted the executives' main focus for the dashboard.

OUTCOME & REFLECTION

Measurable impact

After I passed my design solution to the developer, we launched the initial MVP. We observed their weekly meetings for the employee-facing product dashboards. Based on the observations and metrics we later got from the MVP dashboard, here are the metrics we found —

90%

Visibility Increase

30%

increase in Cost Saving

25%

increase in successful Employee PC onboarding

Reflections

This was the first time I had to work with executives. I initially needed to learn how to effectively make executives understand why my design proposed value to them. However, I talked with my colleagues and manager about effectively communicating executives' value propositions. As a result of that coaching, I could present my design solution to carrier executives, which improved their user experience.

Next steps

We planned to improve the MVP dashboard experience for the executives continuously and venture in accessible problems that I later found out.

Next Work

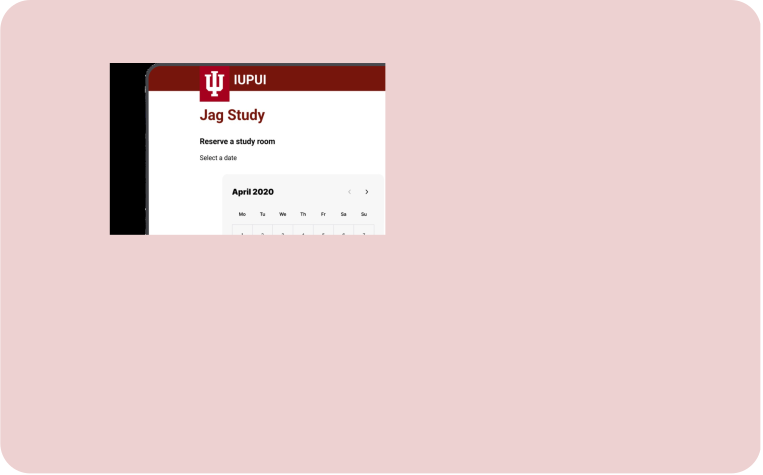
IUPUI Library's Study Room Reservation Portal

Redesigned the study room portal website that helps students reserve a room.

UX Design

UX Design

Education Portal

Education Portal

User Research

User Research

82.1

System Usability Score

Let’s Work Together

Currently open to new opportunities. Feel free to reach out!

Let’s Work Together

Currently open to new opportunities. Feel free to reach out!

Check it out on the desktop version

Hi there. If you want to view more information about this case study. Please View on a Desktop 🖥️ 🙂

Desktop Viewing